---
title: "Continuous Data Graphs"
url: "https://help.esdat.net/en/article/continuous-data-graphs"
language: "en"
last_updated: "2024-07-25T05:05:10.812Z"
---
# Continuous Data Graphs
Logger, Sensor and other continuous data that is being imported into ESdat can be viewed under Data View.
## **Logger Data Summary**
A Logger Data Summary shows users the data being collected at each Location.
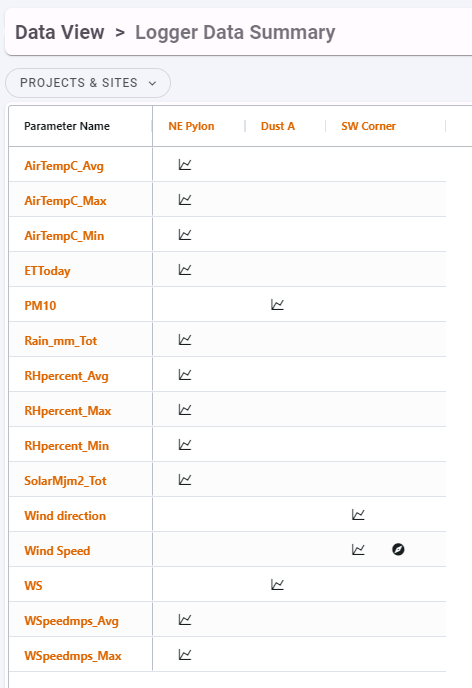
- Clicking on a Location will generate a Graph for all Parameters at that Location.
- Clicking on the Parameter Name will generate a Graph for all Locations with that Parameter.
- Clicking on a timeseries graph icon will generate the graph for that Location and Parameter.
- Clicking on the windrose icon will generate a Wind Rose diagram for that Location (it requires the Location to have both a windspeed and direction).
## **Logger Data Time-series Graph**
Graphs are stacked to enable ease of comparison. If trigger Levels are specified for the Logger Data they can also be shown.
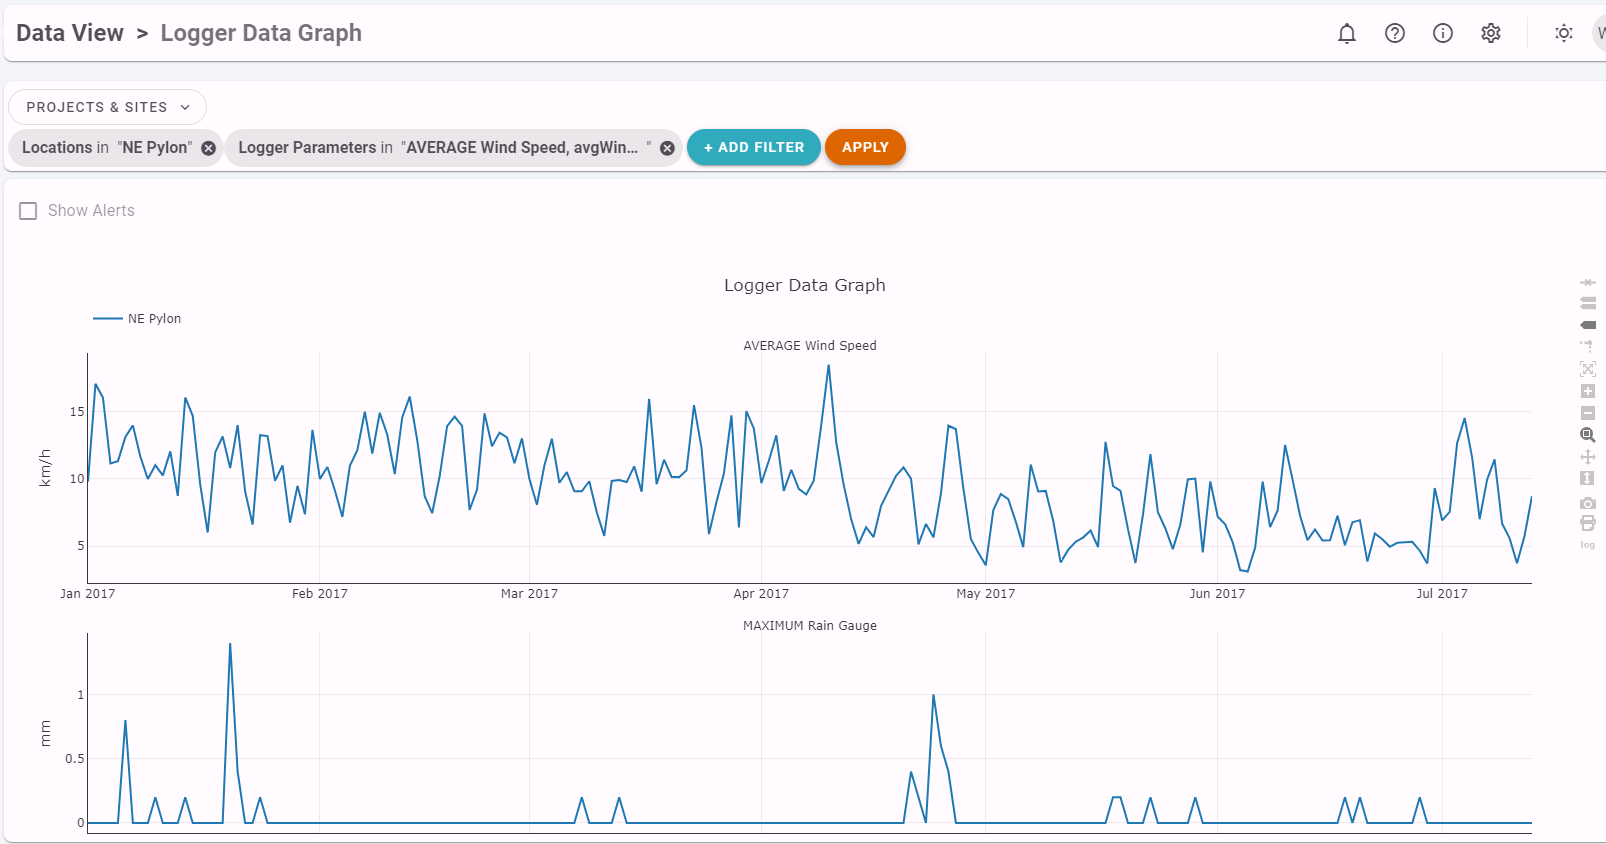
The toolbar to the right of the graph gives options for
|  | - interrogating points,
- zoom,
- copy the graphs to a PNG image file
- print or create a PDF
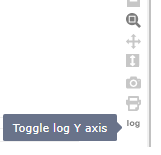
- change the y-axis to a log scale. |
| --- | --- |
## **Wind Rose Diagram**
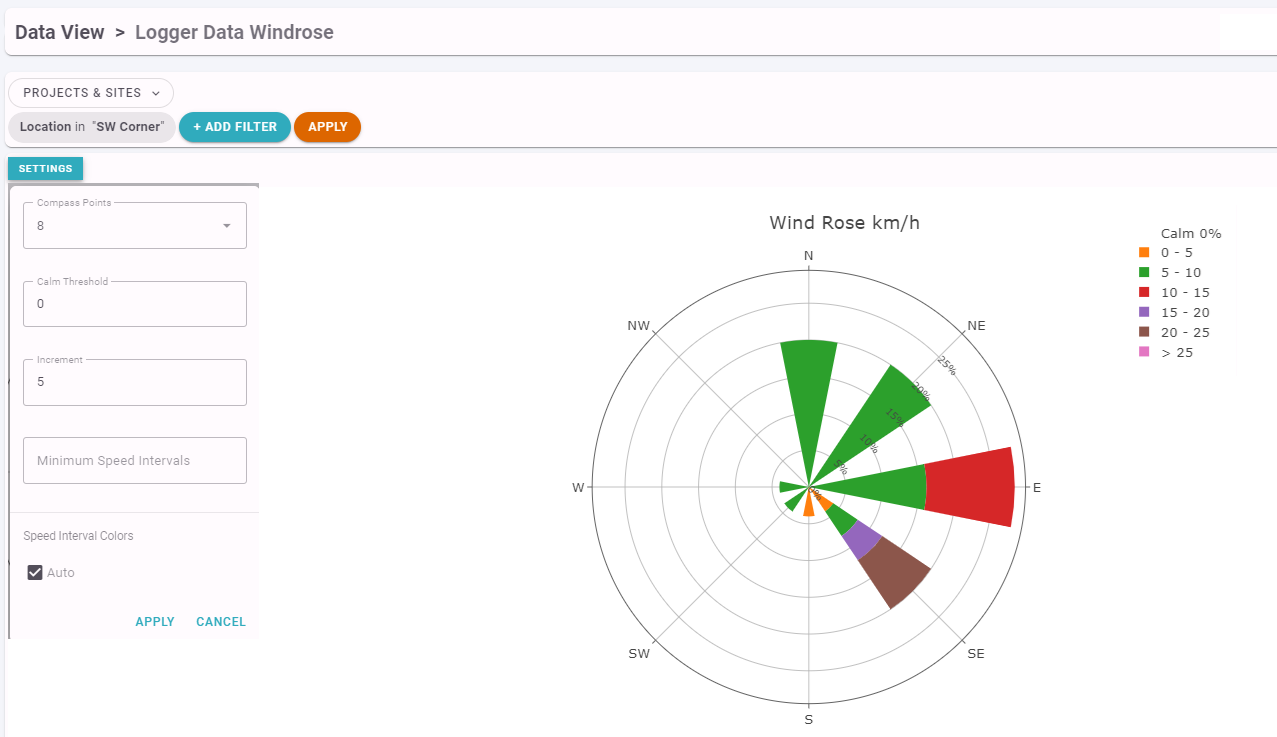
The following settings can be configured for the Wind Rose:
| Compass Points | Choose the precision of the Compass Points
8 = N, NE, E, SE, S, SW, W, NW
16 = N, NNE, NE, ENE, E, ESE, SE, SSE, S, SSW, SW, WSW, W, WNW, NW, NNW |
| --- | --- |
| Calm Threshold | Define the maximum wind speed at which below is considered Calm |
| Increment | Choose the size of the wind rose increments |
| Minimum Speed Intervals | Choose the minimum number of speed intervals shown in the legend |
| Speed Interval Colours | Let ESdat automatically assign colours to the speed intervals (Auto), or manually assign the colours. |