Chemistry Graphs
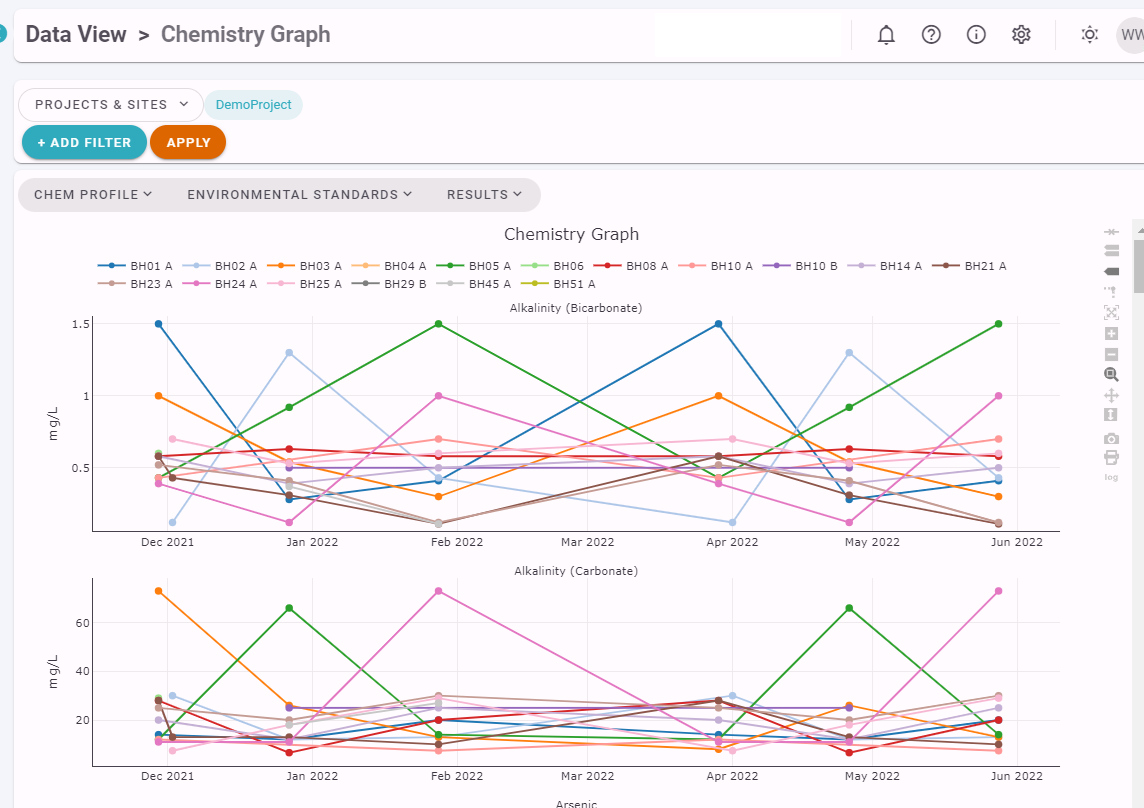
A series of Timeseries Chemistry Graphs, stacked above each other for ease of comparison, and with Environmental Standard or Licence Action Levels shown can be easily produced in ESdat, as shown below.
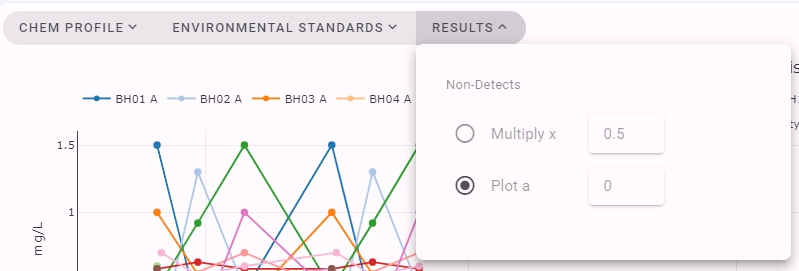
Non-detects can be graphed as a particular value (e.g. 0) or using a non-detect multiplier.
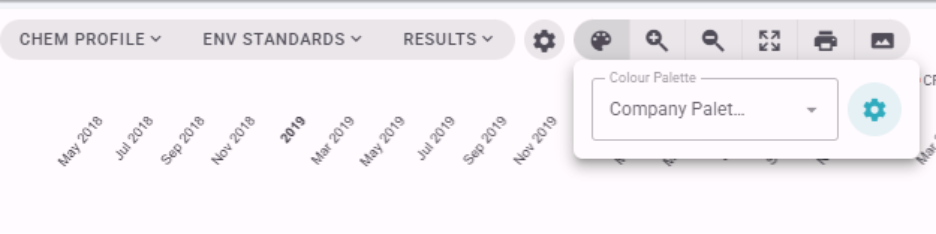
Custom Color Palettes
Chemistry Graphs can be customized with color palettes to make it easier to distinguish Locations and tailor graphs to your reporting requirements. Create and customize your own color palettes in the Settings menu, then apply them to your Chemistry Graphs for clear, consistent visualizations.
The toolbar to the right of the graph gives options for
 |
|