
Chemistry Graphs
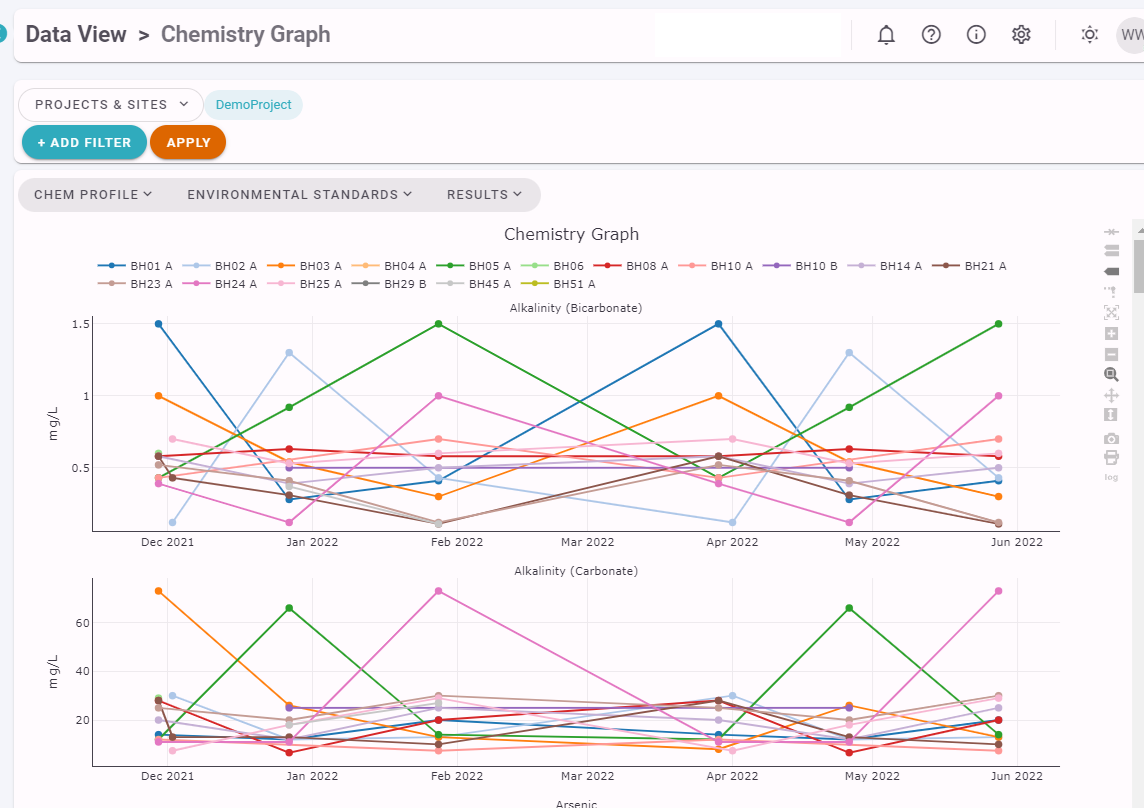
A series of Timeseries Chemistry Graphs, stacked above each other for ease of comparison, and with Environmental Standard or Licence Action Levels shown can be easily produced in ESdat, as shown below.
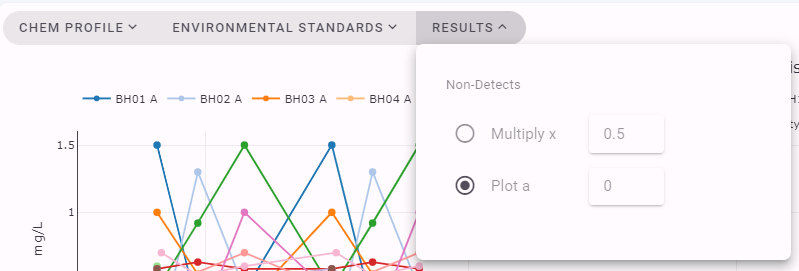
Non-detects can be graphed as a particular value (eg 0) or using a non-detect multiplier.
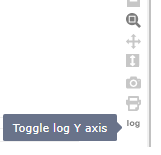
The toolbar to the right of the graph gives options for
 |
|