
Chemistry Tables
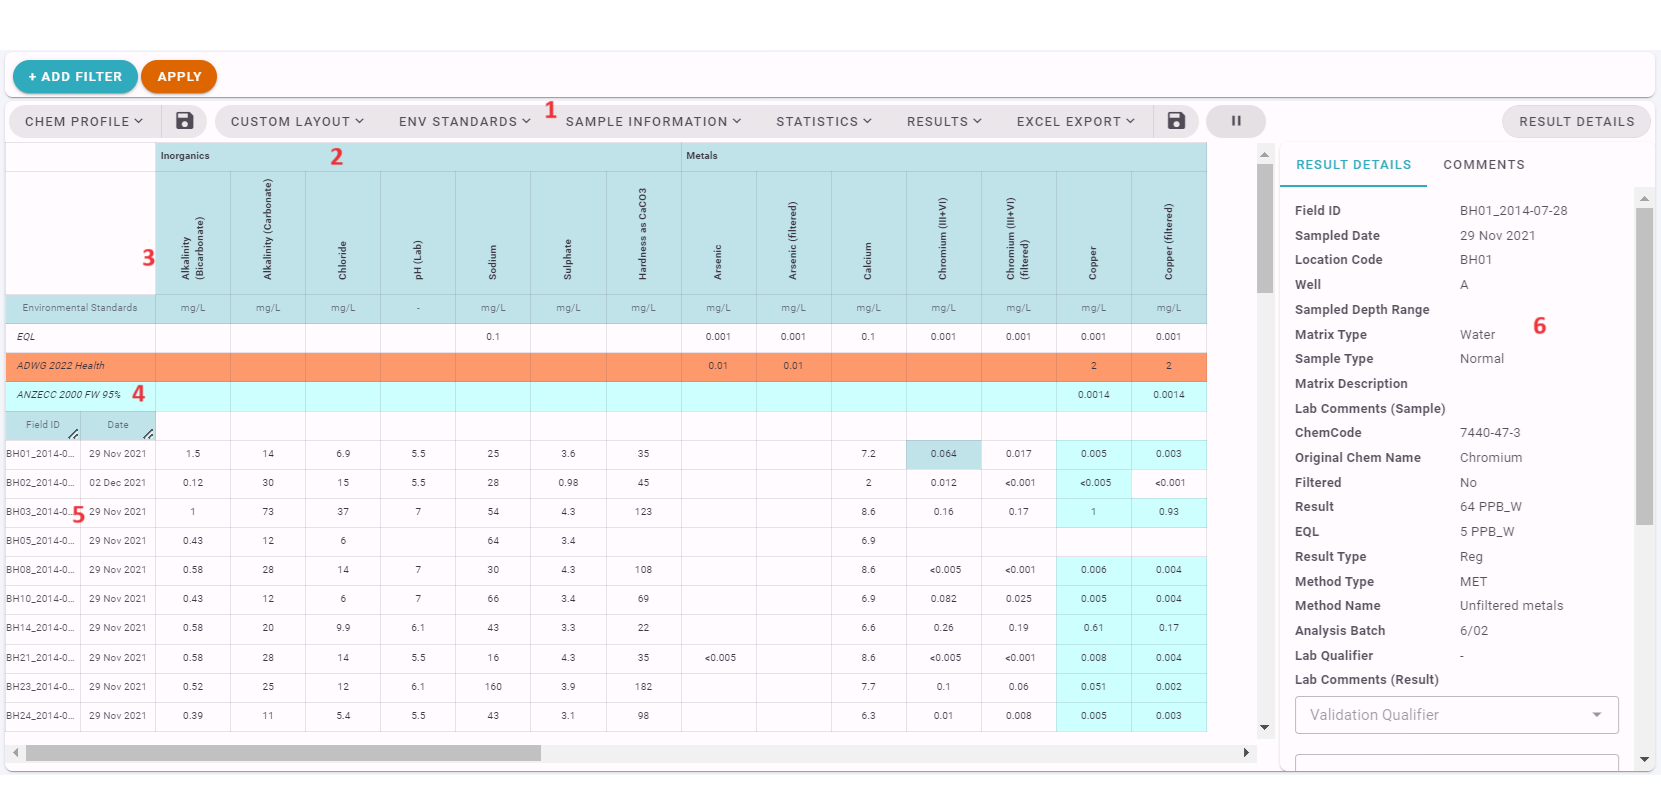
The main components of the Chemistry Table are:
- The menu, that controls the Table layout and display.
- Analyte Groups, this can be customized under Chem Profile.
- The Analytes, the Analyte Name, Order and Output Unit can be customized under Chem Profile
- Environmental Standards: which can be controlled from the Env Standards menu.
- Sample Details. These can be turned on and off and ordered in the Sample Information menu.
- Result details & comments, click on the button to toggle this panel on or off.
- Statistics for the results (these can be hidden).
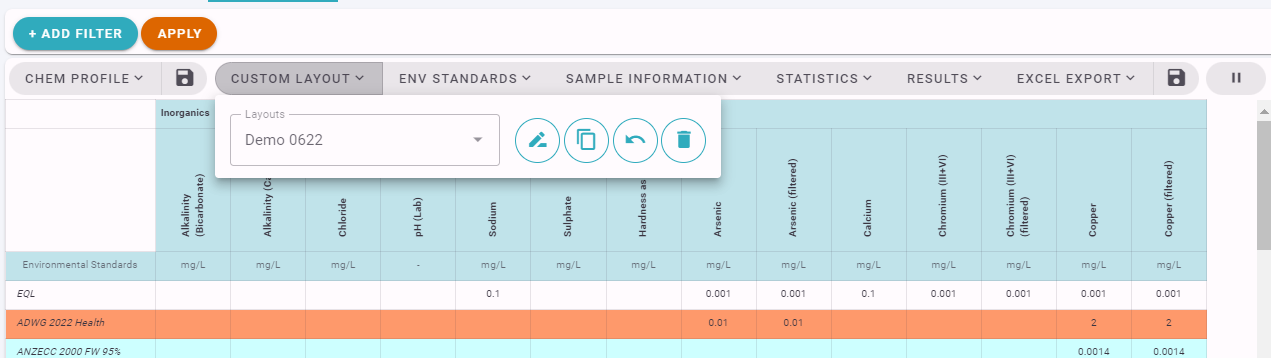
Saving your Settings
The Table Layout allows you to save your menu options so they can be easily reapplied to a table.
The Chem Table is automatically refreshed as you make changes to any of the Layout options. If you are planning on making several changes, you can disable the automatic refresh by clicking the pause button  Hit the play button
  to resume refreshing the table.
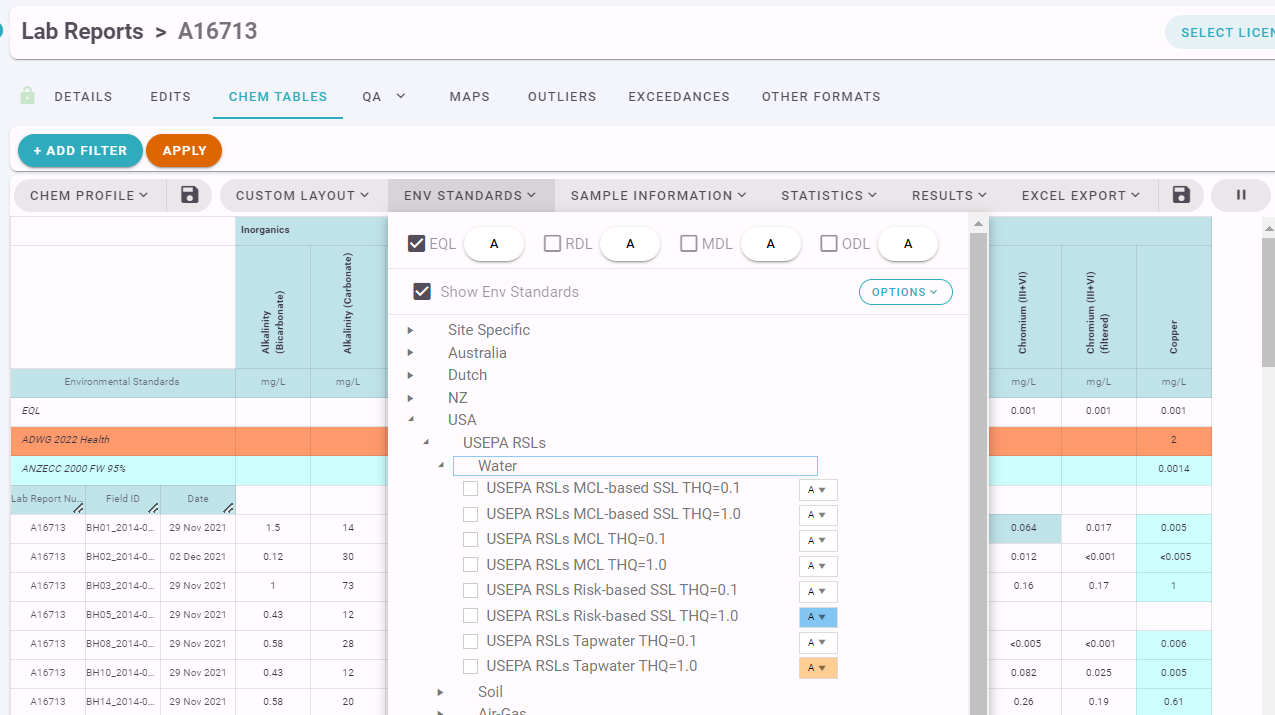
Environmental Standards
Environmental Standards which are loaded into the system can be displayed and formatted under the Env Standards menu.
If users need to consolidate multiple Action Levels into one, this can be done using the MetaStandards functionality.
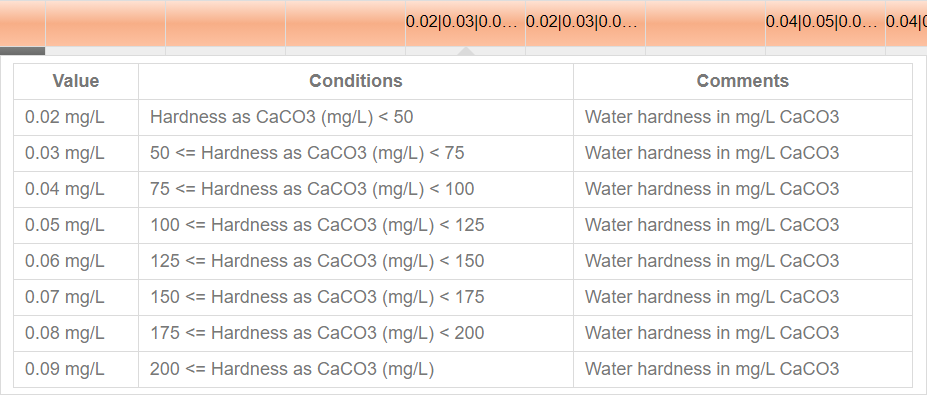
Sometimes standards can have variable Action Levels conditional on pH, Hardness or other parameters (termed Conditional Standards in ESdat). Users can choose to show each Action Level or can show a range from the min to max. Hovering over the cell will show all the Action Levels.
Sample Information
The Sample Information menu allows users to choose which fields are shown on the Chemistry Table. Much of the basic Sample Information (such as Location and Depth) can be edited on the Lab Report Details page, the Field Portal or bulk edited in the Import / Update / Export section.
The Samples shown on the Chemistry Table are sorted in the order of the displayed Sample fields. The order of the fields can be altered by dragging the names on the menu.
If you want to sort your data by Location and then by Date, you would set the Samples to show the Location before the Date.
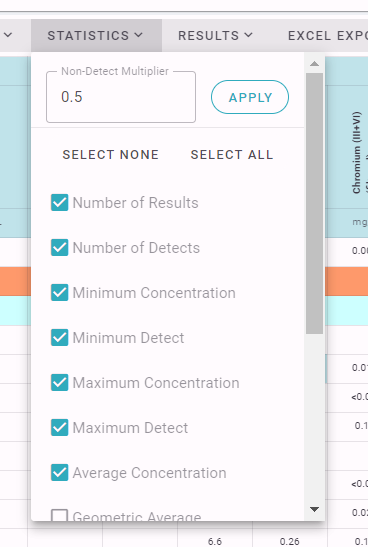
Statistics
The following Statistics can be shown on the Chem Table:
The geometric average / standard deviation is also known as the log average / standard deviation.
Result Details, Qualifiers and Comments.
Users can see full details for a result by toggling on the Result Details and Comments panel and then clicking on each result in the Chem Table.
This shows the result data as is it stored in the database and allows users to enter their own data Validation and Final qualifiers and comments for each individual result. This can be useful where there may be an issue with a result, or where concentrations are high.
Users can define their own Qualifiers, however it is recommended the standard USEPA qualifiers be used where applicable:
- U The analyte was analyzed for, but was not detected above the level of the Reported sample quantitation limit.
- J The result is an estimated quantity. The associated numerical value is the approximate concentration of the analyte in the sample.
- J+ The result is an estimated quantity, but the result may be biased high.
- J- The result is an estimated quantity, but the result may be biased low.
- R The data are unusable. The sample results are rejected due to serious deficiencies in meeting Quality Control (QC) criteria. The analyte may or may not be present in the sample.
- UJ The analyte was analyzed for, but was not detected. The Reported quantitation limit is approximate and may be inaccurate or imprecise.
Result Qualifiers and Comments can be toggled to display with each result on the main body of the table using the Results Menu.
If all of the Final, Validation and Lab Qualifer are turned on, the Final Qualifier will show against a result, if it is populated. If it isn't populated the Validation Qualifier will show (if populated), otherwise the Lab Qualifier will show. Comments work using the same heirarchy.
Excel Export
The Excel Export menu allows users to export the Chem Table to Excel, as well as configuring default export settings.
There are two orientation options for exporting a Chem Table to Excel:
- Horizontal - exports the Chem Names horizontally across the page (ie as shown in the browser).
- Vertical - export the Chem Names vertically down the page
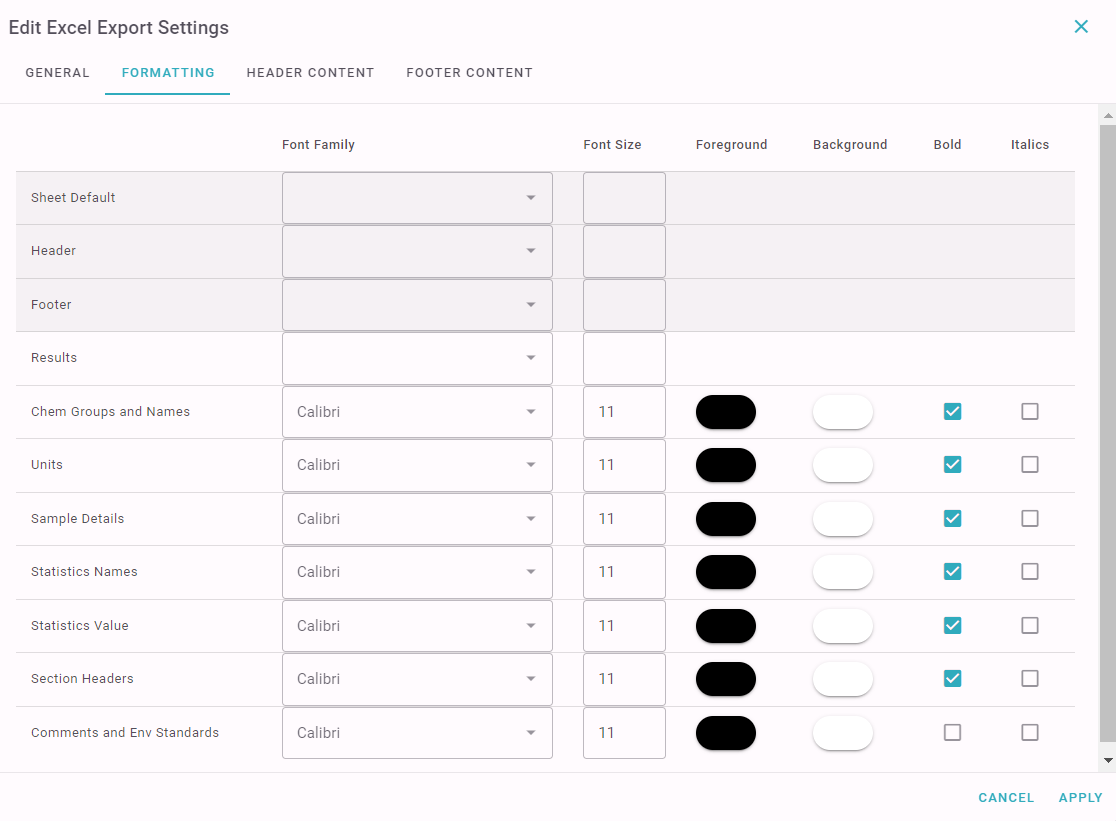
The Excel Export Settings allow users to configure settings for the print view and how the report will be shown in Excel.
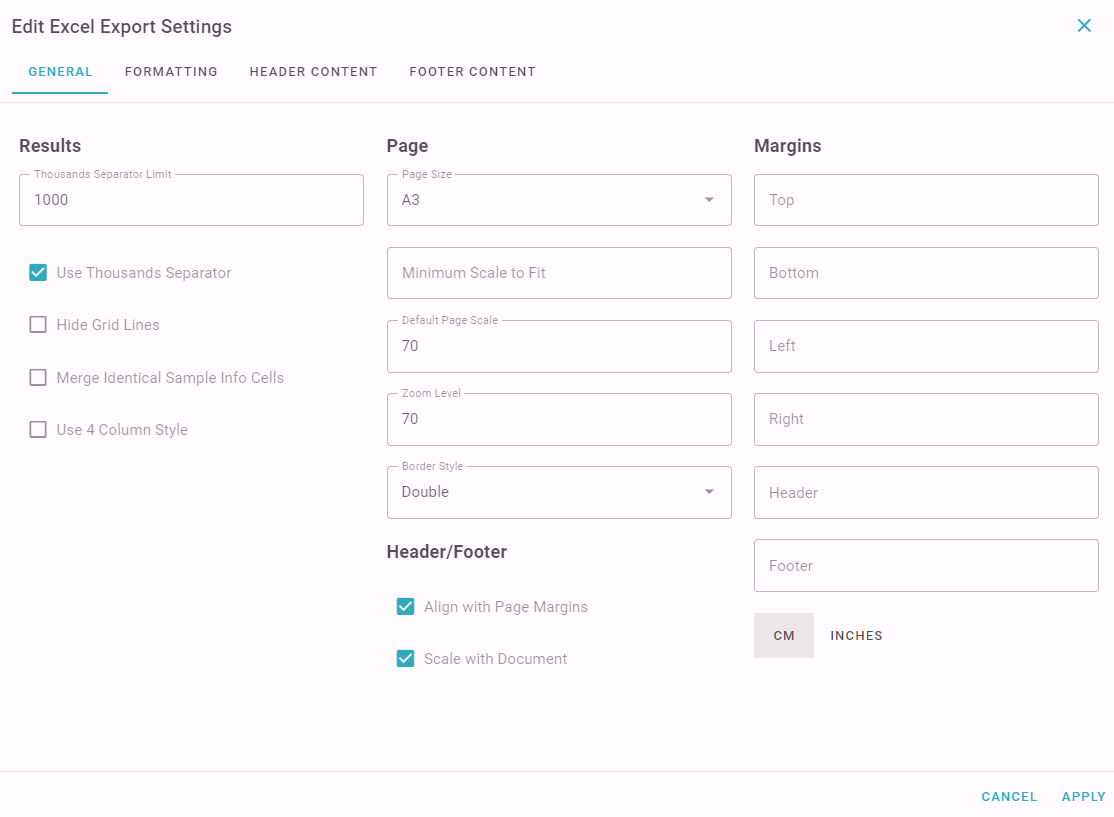
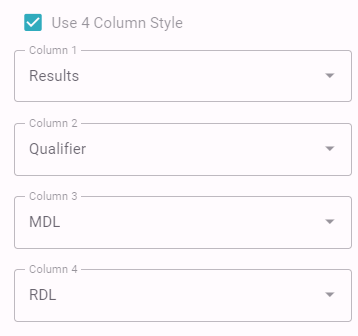
The "Use 4 Column Style" option on the General tab exports 4 cells for each result, which can be individually populated as below. This can be used to display multiple Detection Limits for each result, if populated by the laboratory (EQL = Estimated Quantitation Limit, MDL = Method Detection Limit, RDL = Reported Detection Limit, ODL = Other Detection Limit).
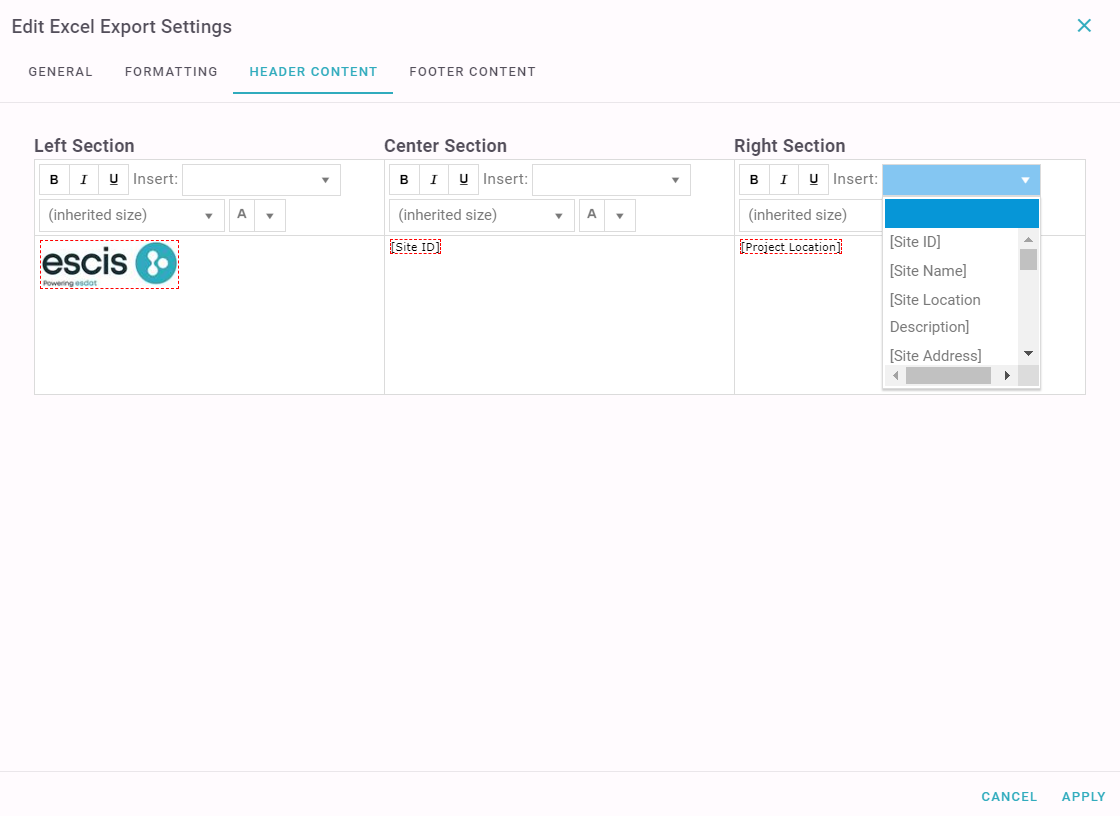
Header and footer content can be automatically populated with Project or Site details using a drop-down of available data fields. Auto values (populated by ESdat or Excel) are shown with a red border. If a logo has been uploaded in Licencee Management it will also be available in this drop down.
Free text can also be typed into the cell with font formatting available.
The Footer content is configured the same as for the Header, and has the same options.
There is a length limit to how much content can be set in Excel headers and footers, which is an Excel constraint. If the allowed length is breached an error notification will be displayed in the print view and the content will need to be revised to fit.