Chemistry Trend Analysis
ESdat Supports Trend Analysis using the Mann-Kendall and Linear Regression statistical techniques. ESdat also provides a "Last Value is Highest" identification.
Mann-Kendall is described originally in the following texts, and is also described in numerous textbooks describing stastical techniques for environmental data.
- Mann, H.B. 1945. Non-parametric tests against trend, Econometrica 13:163-171.
- Kendall, M.G. 1975. Rank Correlation Methods, 4th edition, Charles Griffin, London.
The ESdat help documentation describes only the application of Mann-Kendall and Linear Regression techniques within ESdat. For a description of these stasticical techniques ESdat users will need to refer to the above references or statistical textbooks. ESdat applies Mann Kendall with a "one-tailed Mann-Kendall" approach, as opposed to a "two-tailed Mann-Kendall", which is the typical application.
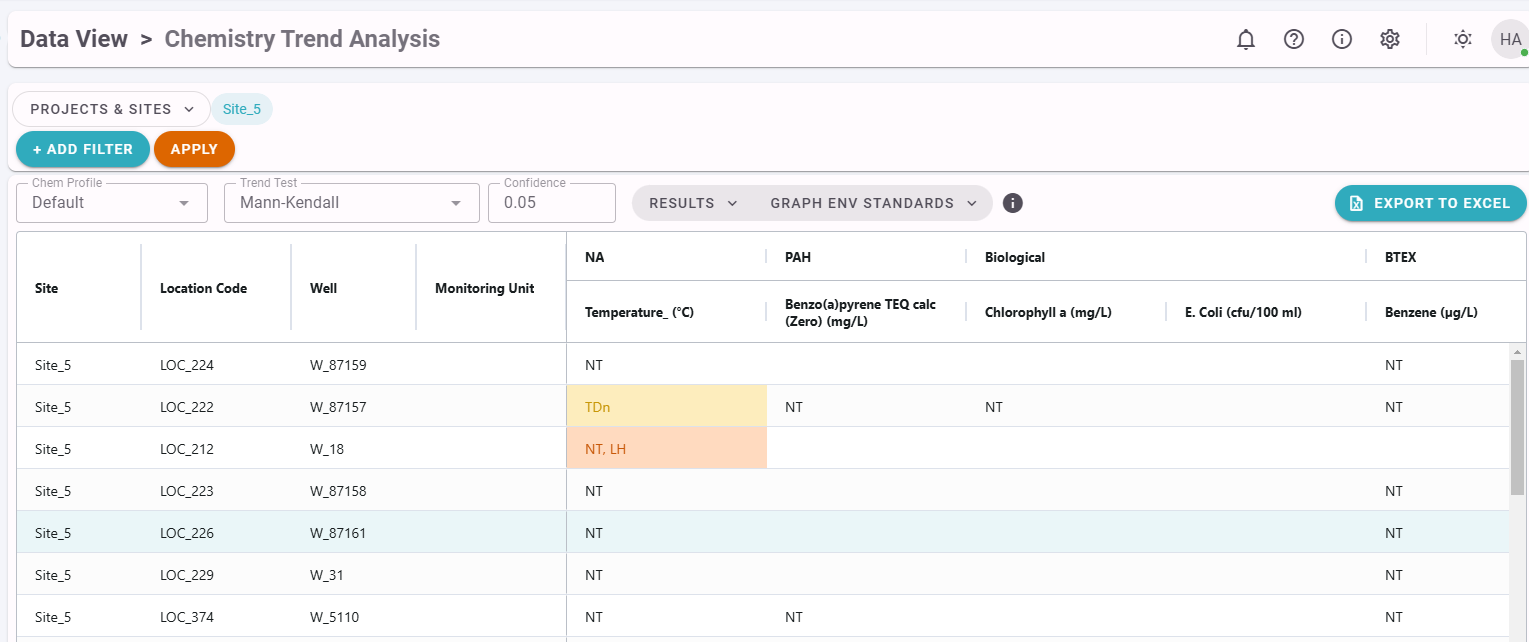
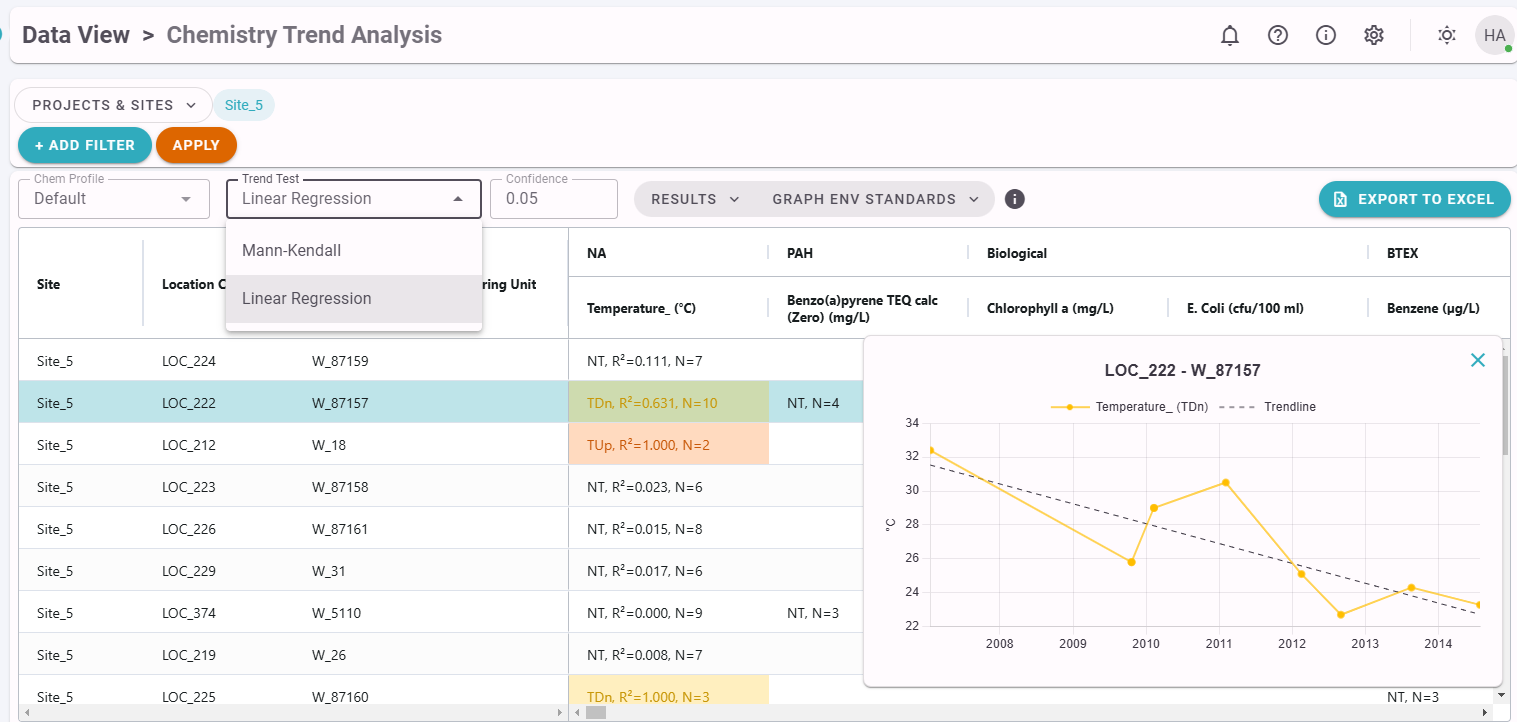
Within the Trend Analysis screen in ESdat users can select either Mann Kendall or Linear Regression as the technique, specify a Significance Level (A Significance Level of 0.05 relates to a Confidence Level of 95%; 0.1 relates to 90%) and the trend results will be shown.
Trends are always shown per analyte, for each Location & Well. At least 3 data points in order to calculate a trend. Trends are identified by:
- TUp = Trending Up (shaded in orange)
- TDn = Trending Down (shaded in yellow)
- LH = Last Value Highest (shaded in orange)
- NT = No Trend
- Blank Cell = No data, or not enough data (<3 data points) to calculate a trend.

Users can select to show the trend stastics as well as the trend result, and clicking on a trend result will show a graph of the data, as shown below.

