Dashboards
ESdat provides a powerful dashboarding option, allowing you to arrange graphs, maps, tables, notifications and similar outputs so that the information you most want to refer to is automatically presented on opening ESdat.
In Edit mode the dashboard Widgets can be dragged from the "Add Widgets" panel on the right and placed and sized as needed.
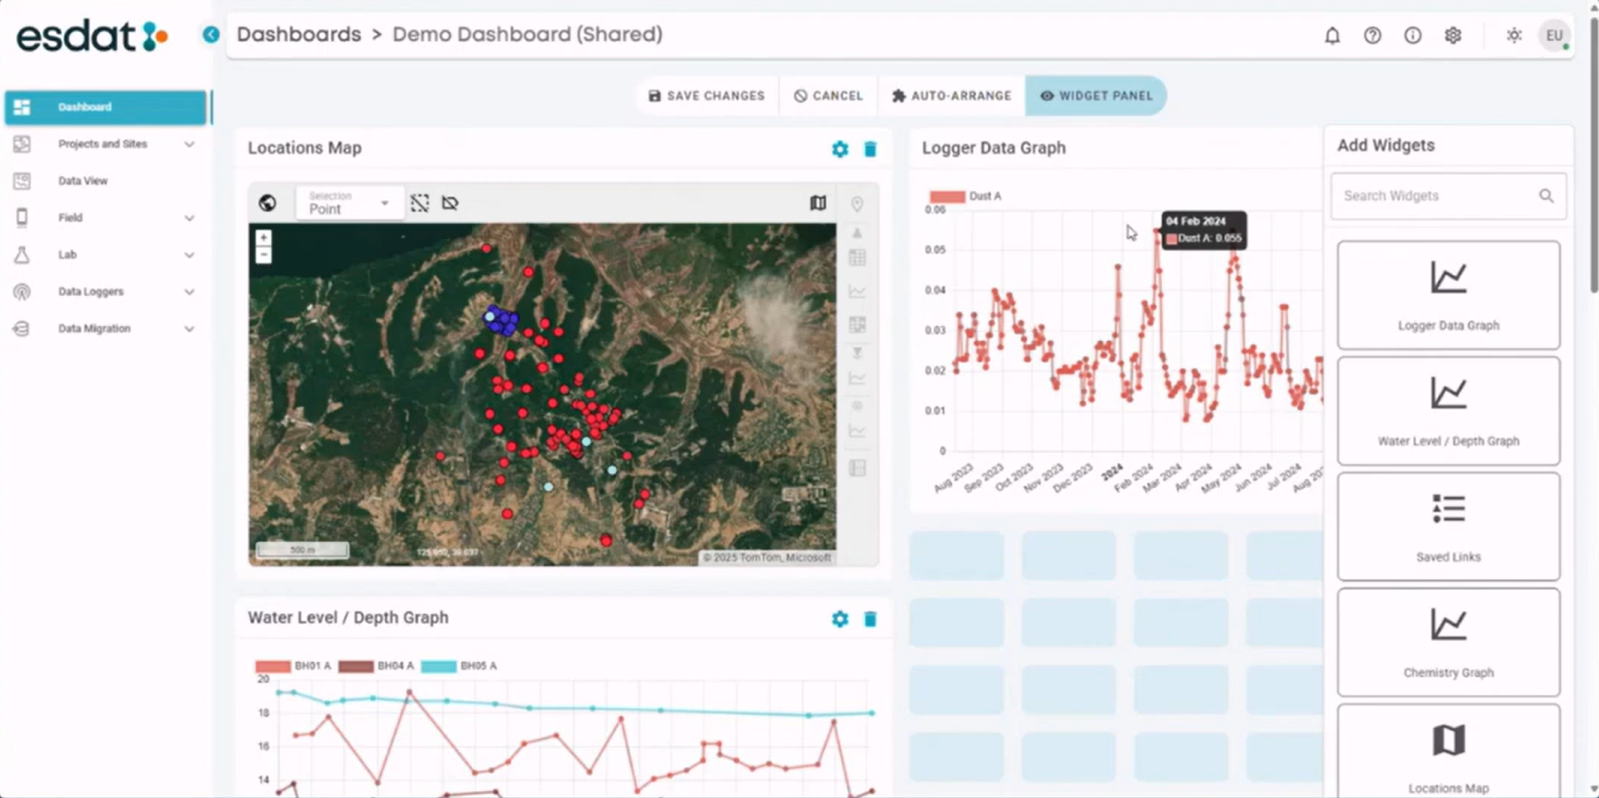
Available Widgets are:
Dashboard Filter
This optional widget can be used to interactively filter the data viewed on the other widgets on the dashboard by Project(s), Site(s) or Location(s).
Selecting one or more Projects, Sites on Locations in this Filter Widget will filter data on the other widgets to the selection in this Widget. It is particularly useful for situations where a user may be using ESdat to manage multiple Sites.
The Dashboard Filter, if used, is applied on top of any filters that may be applied on other widgets in their configuration.
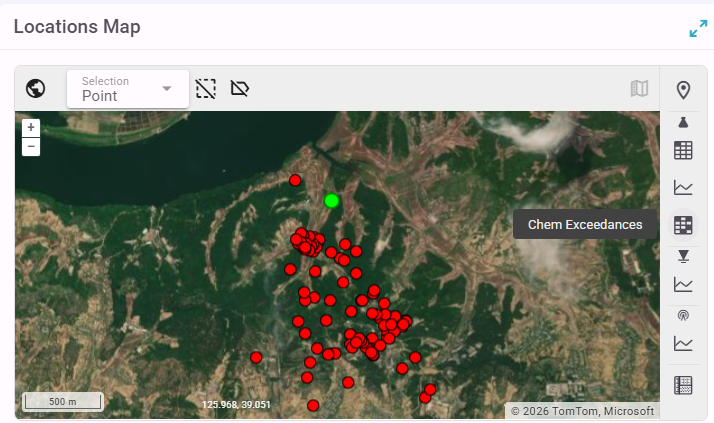
Locations Map
This widget users to select one or more locations on the map and shortcut to different Data Views. Once locations are selected, the icons on the right hand side will show the available data views that can be generated. Clicking one of these will load the data view with the relevant Locations filtered.
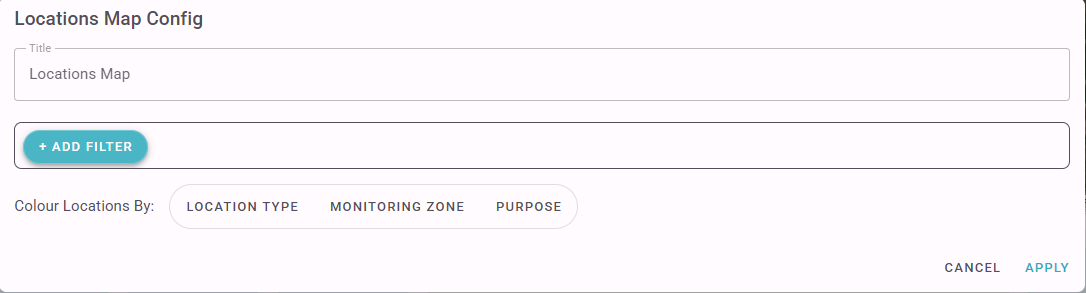
The Locations Map Config allows you to specify a colouring option for the points, and to specify a Site/Project Filter.
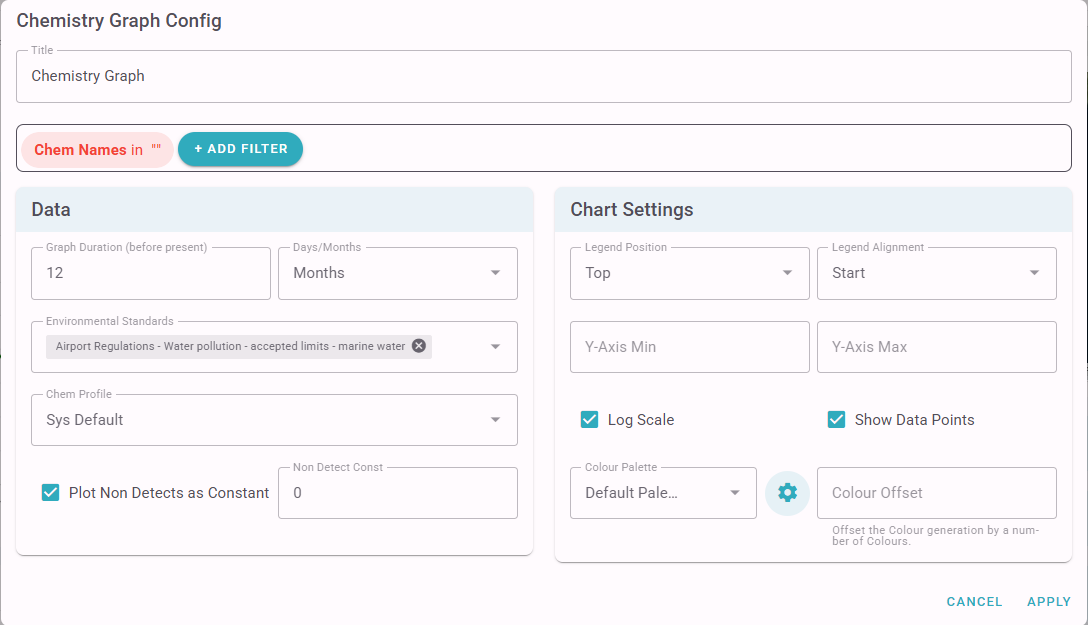
Chemistry Graph
The Chemistry Graph widget requires you to specify one or more Analytes to include on the graph. Other filter items (eg Location) can also be specified.
As with all the graphs you can specify the graph duration (before present) as well as legend, colours and other settings. You can also specify any Environmental Standards to include, and if you want to plot non-detects with a specific value (non-detect data points will also be plotted as a hollow symbol as per the standard approach in ESdat).
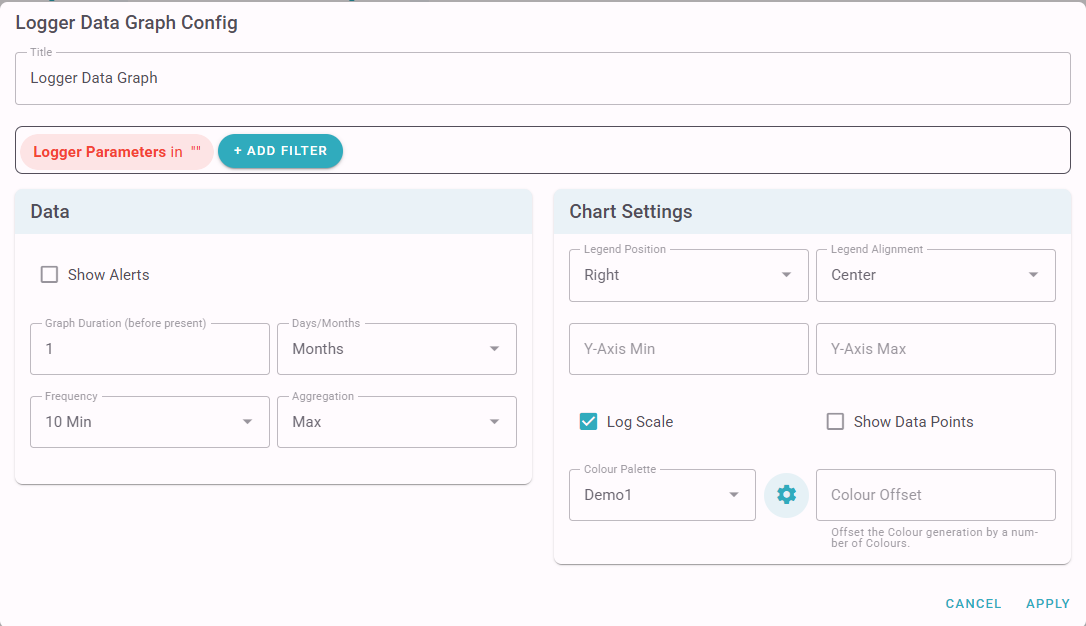
Logger Data Graphs:
The Logger Data Graph widget requires you to specify one or more parameters to include on the graph. Other filter items (eg Location) can also be specified.
As with all the graphs you can specify the graph duration (before present) as well as legend, colours and other settings. For Logger Data you can also specify a data aggregation frequency and type (eg the max value every 10 minutes).
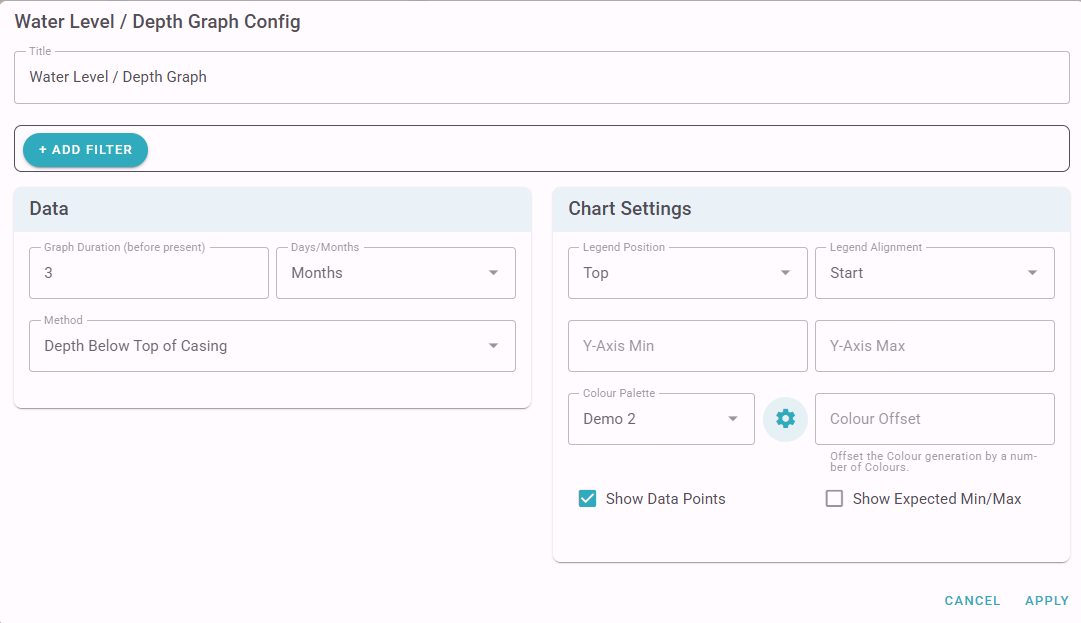
Water Level / Depth Graph
The Water Level / Depth Graph widget requires you to specify if you will be graphing the Water Depth below Top of Casing, Water Depth below Ground Level, or Water Elevation. Filter Items are optional.
As with all the graphs you can specify the graph duration (before present) as well as legend, colours and other settings. The expected Min/Max water depths for each well can also be optionally shown.
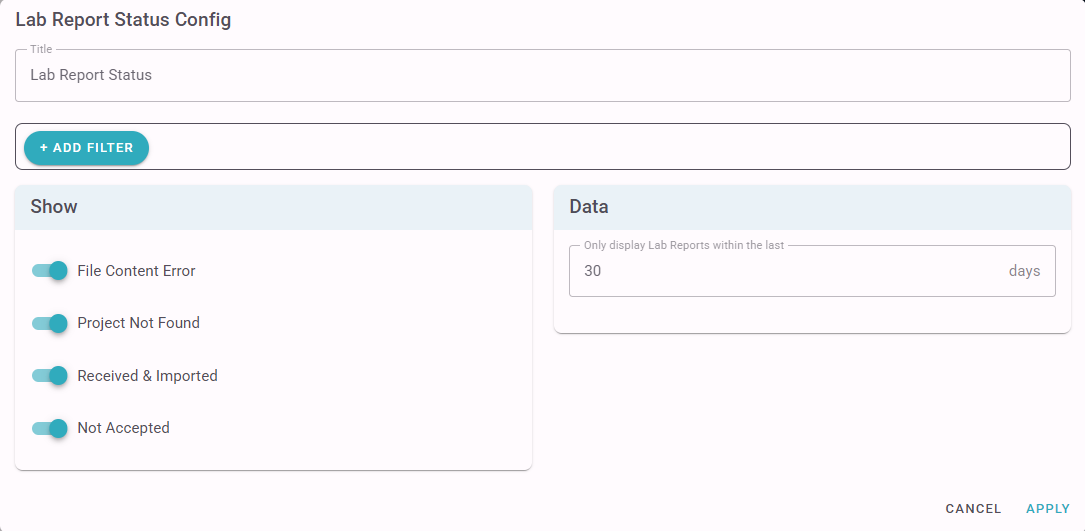
Lab Report Status
The Lab Report Status widget provides a summary of the number of lab reports received within the last N days and their status.
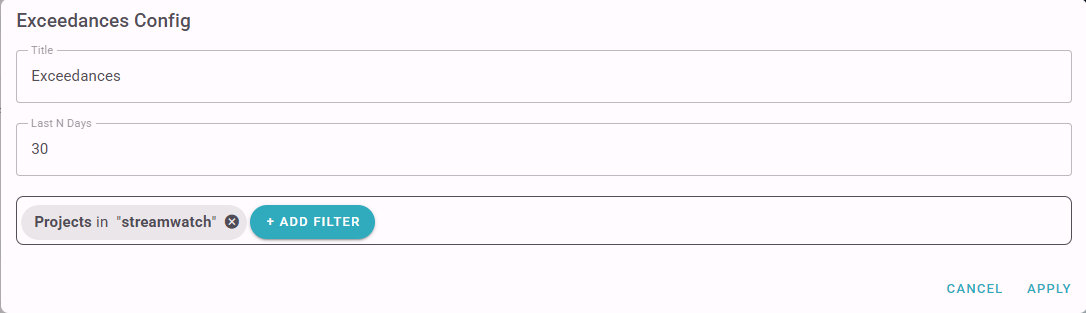
Exceedances
The Exceedances widget lists Lab Report and Field data Exceedances in the last N days.
In order to be listed Environmental Standards must be associated with Site when the data is collected (As with Notifications, associating an Environmental Standard with a Site after the data is collected won't Trigger an Exceedance Notification).
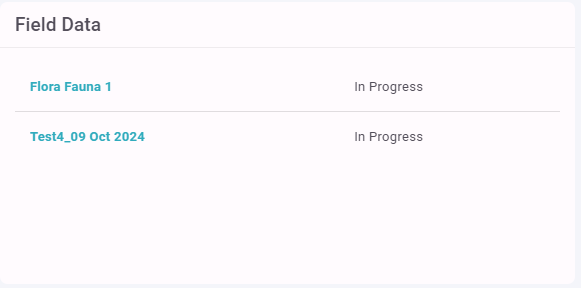
Field Data
The Field Data widget lists Active Monitoring Rounds and their current status.
There is no configuration, except for the ability to specify a Project/Site filter.
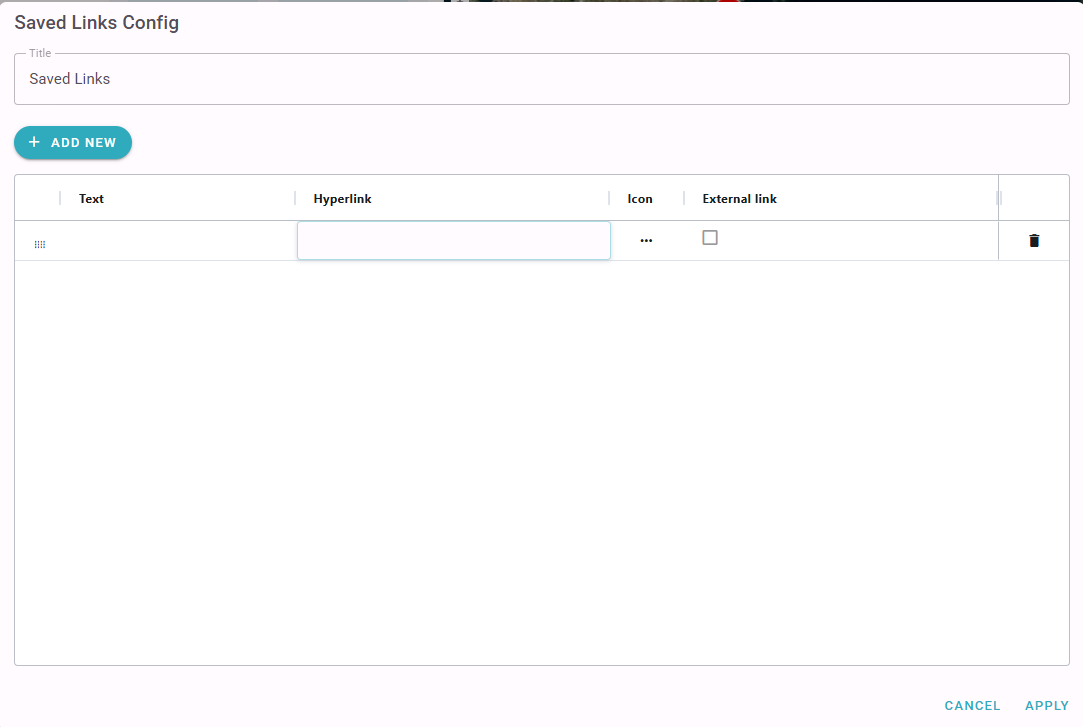
Saved Links
The Saved Links widget allows you to save shortcuts to useful URL's that are either pages within ESdat or from other websites.